

What the DR4 Preview Did to 305 Directory Sites
Ahrefs previewed DR4 on 5 November. I checked 305 directory sites the next day: the mean fell from 57.5 to 43.2, 73.4% dropped, and monthly traffic explains most of the spread.


Ahrefs published a preview of Domain Rating version 4 on 5 November 2026. The full switch happens on 1 December, but the preview numbers are already queryable, so I pulled them for 305 directory sites: the kind of site a maker submits a launch to, and the kind whose DR gets quoted in "where to launch" spreadsheets.
I looked up every domain's DR3 and DR4 on 6 November. The mean fell from 57.5 to 43.2. 73.4% of the sample dropped. The size of the drop follows monthly organic traffic closely: small directories lost the most, the largest ones barely moved.
How the score is calculated
Three rules in the DR model explain everything that follows.
DR is relative. It measures how strong a site's backlink profile is compared with every other site in the same index, then maps that onto 0–100. A DR 100 site cannot grow to 101; it can only push other sites down. So a site can lose points for two different reasons: its own links got worse, or other sites got better. In a spreadsheet the two look identical.
Link weight is split across the domains you link to. A domain divides the rating it earned among every domain it links out to. Ahrefs' own example: a DR 10 site linking to three domains can move a target more than a DR 80 site linking to a million. For a directory this is a structural problem. A directory links out to thousands of product pages by design, so each outbound link carries a sliver of a sliver.
The scale is logarithmic. Ahrefs puts it plainly: going from 84 to 85 is much harder than going from 54 to 55. Which means losing 10 points at 90 is not the same loss as losing 10 points at 40, and comparing raw differences across the scale is misleading.
What v4 changed
The pool of domains that can affect DR roughly halved. The new model weights links from sites that are assessed as having organic search traffic. Ahrefs reports that the number of sites with a DR4 score is about half the number with a DR3 score. A smaller pool means fewer sites transmitting weight.
Subdomains no longer inherit the parent score. This was the most requested change. Ahrefs' published examples show the range of the effect:
| Subdomain | DR3 | DR4 |
|---|---|---|
| play.google.com | 100 | 96 |
| blogs.microsoft.com | 96 | 87 |
| help.ahrefs.com | 91 | 75 |
| insights.samsung.com | 92 | 73 |
| example*.hostingersite.com | 92 | 1.9 |
| example*.notion.site | 92 | 0 |
Spam scores came down. Among domains flagged as spam with a DR3 between 30 and 70, the median DR4 change is a loss of 15 to 20 points. Ahrefs describes non-spam sites as relatively stable, with median change near zero across DR3 bands.
For comparison, among the top 1,000 sites by organic traffic, 64.3% rose, 15.8% were unchanged and 19.9% fell, with the falling group averaging a 7.3 point loss (median 4).
The aggregate shift
305 directory sites, DR3 and DR4 queried per domain on 2026-11-06. DR4 values are still preview figures and may be adjusted before 1 December.
| Metric | DR3 | DR4 | Change |
|---|---|---|---|
| Mean | 57.5 | 43.2 | −14.2 |
| Median score | 59 | 41 | −18 |
| P25 | 42 | 25 | −17 |
| P75 | 73 | 66 | −7 |
| Max | 93 | 92 | — |
| Min | 19 | 0 | — |
224 sites fell (73.4%), 66 rose (21.6%), 15 were unchanged (4.9%). By size, 154 sites lost 10 or more points (50.5%) while only 11 gained that much (3.6%).
P25 lost 17 points and P75 lost 7. The bottom of the sample was compressed much harder than the top, so the whole distribution slid down unevenly.
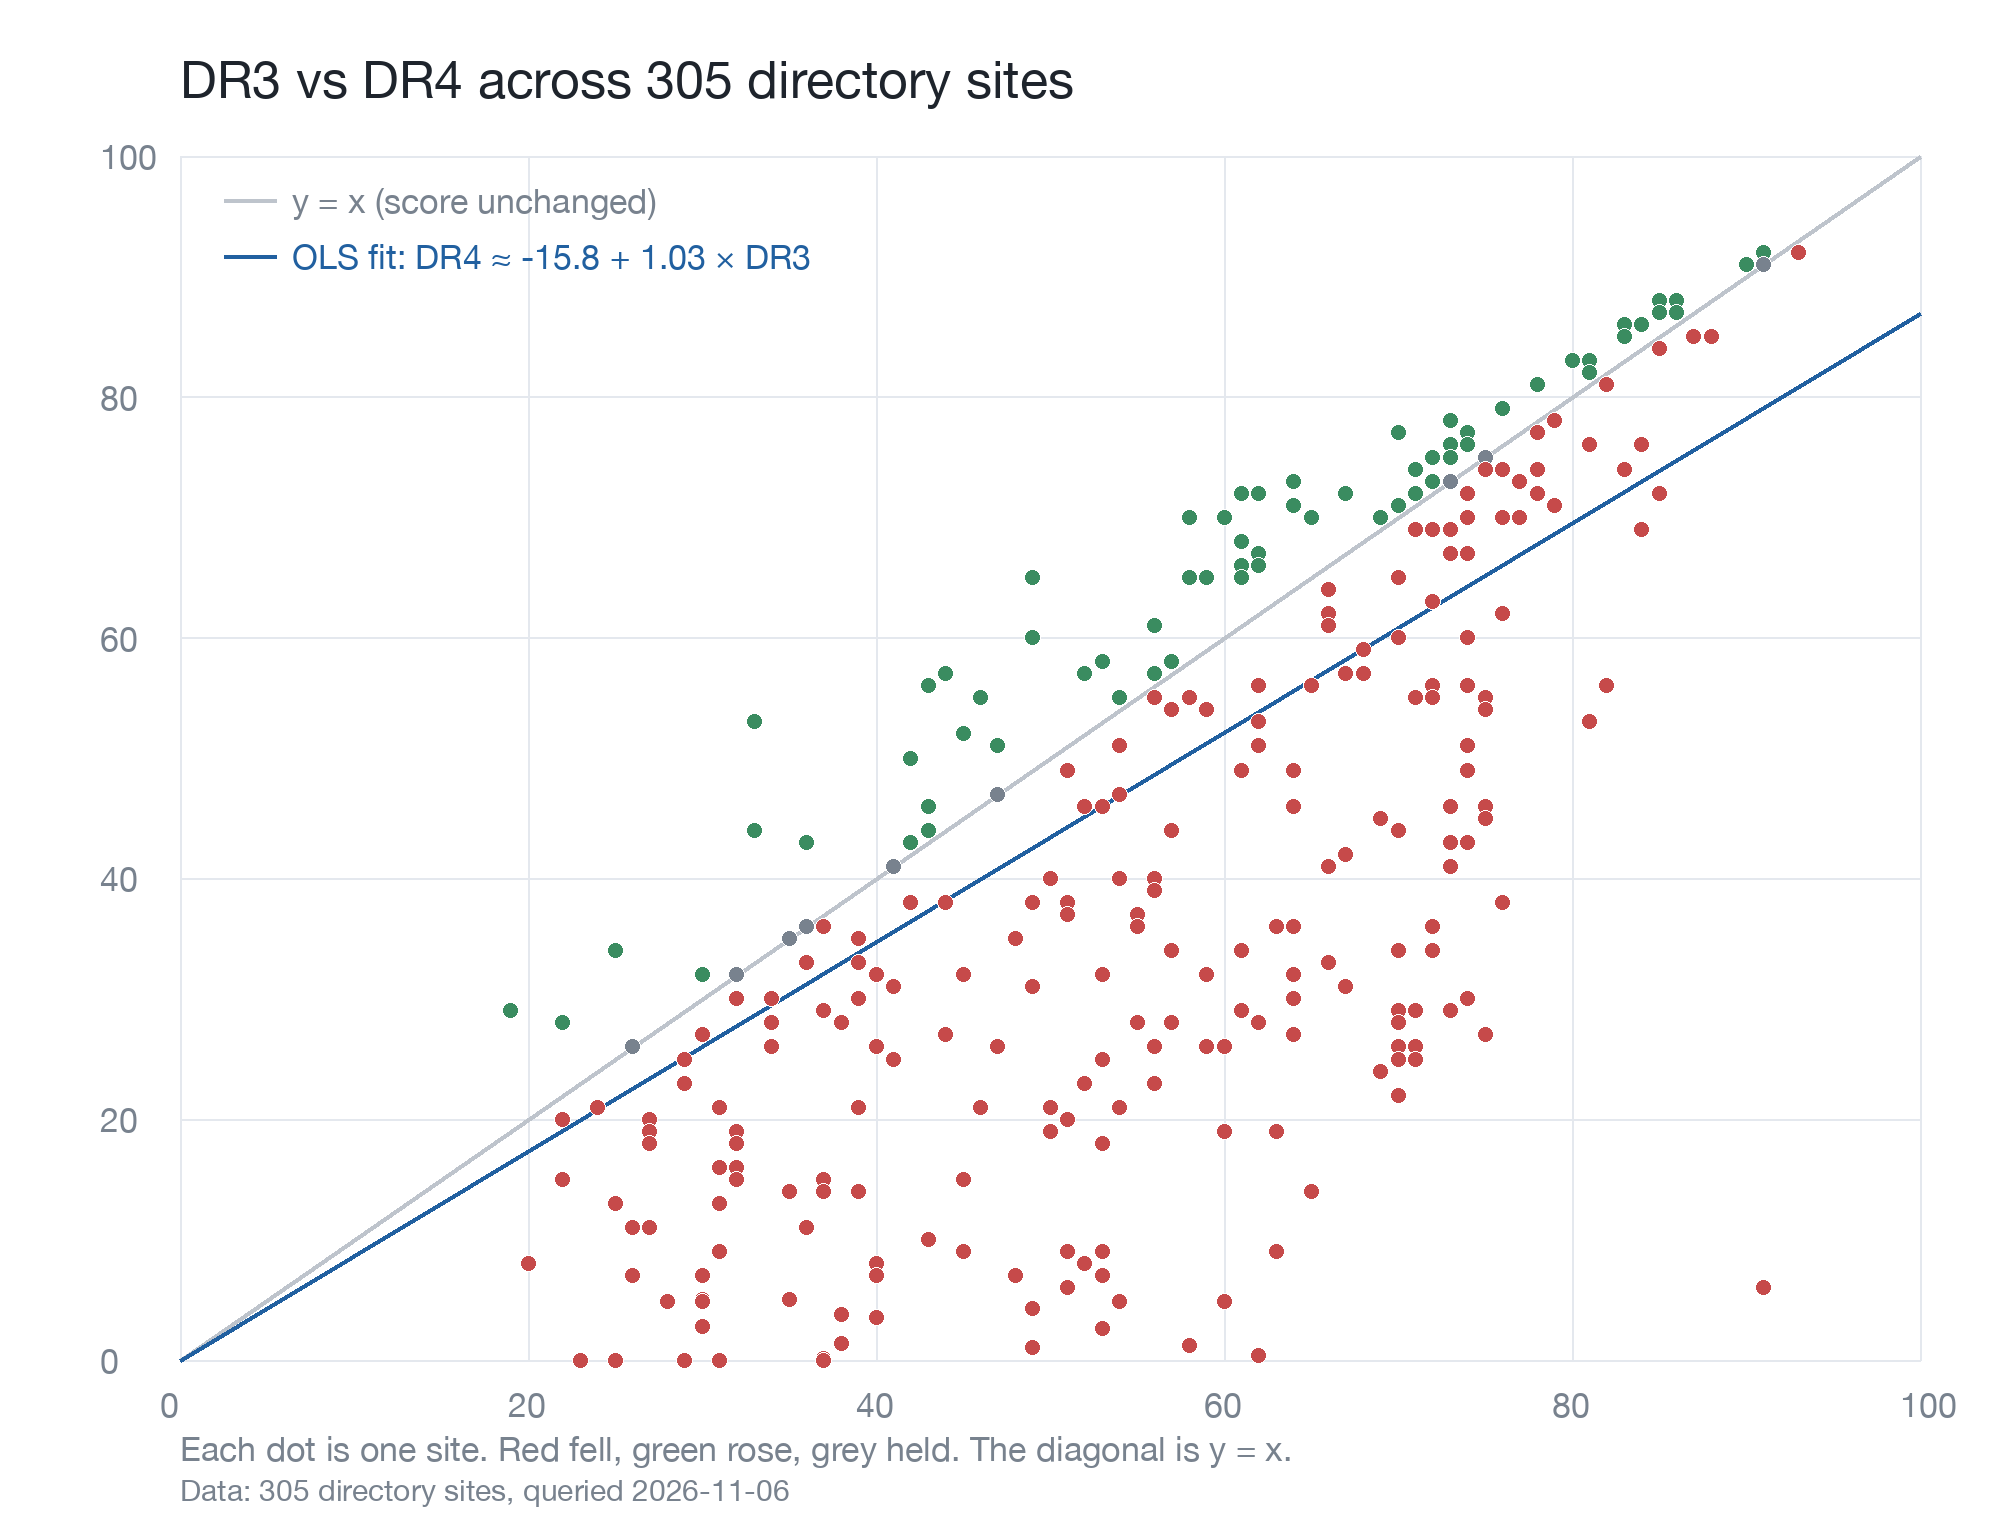
Each point is a site, the grey line is y = x (no change). Most points sit below it, and the further left you look, the further they sit.
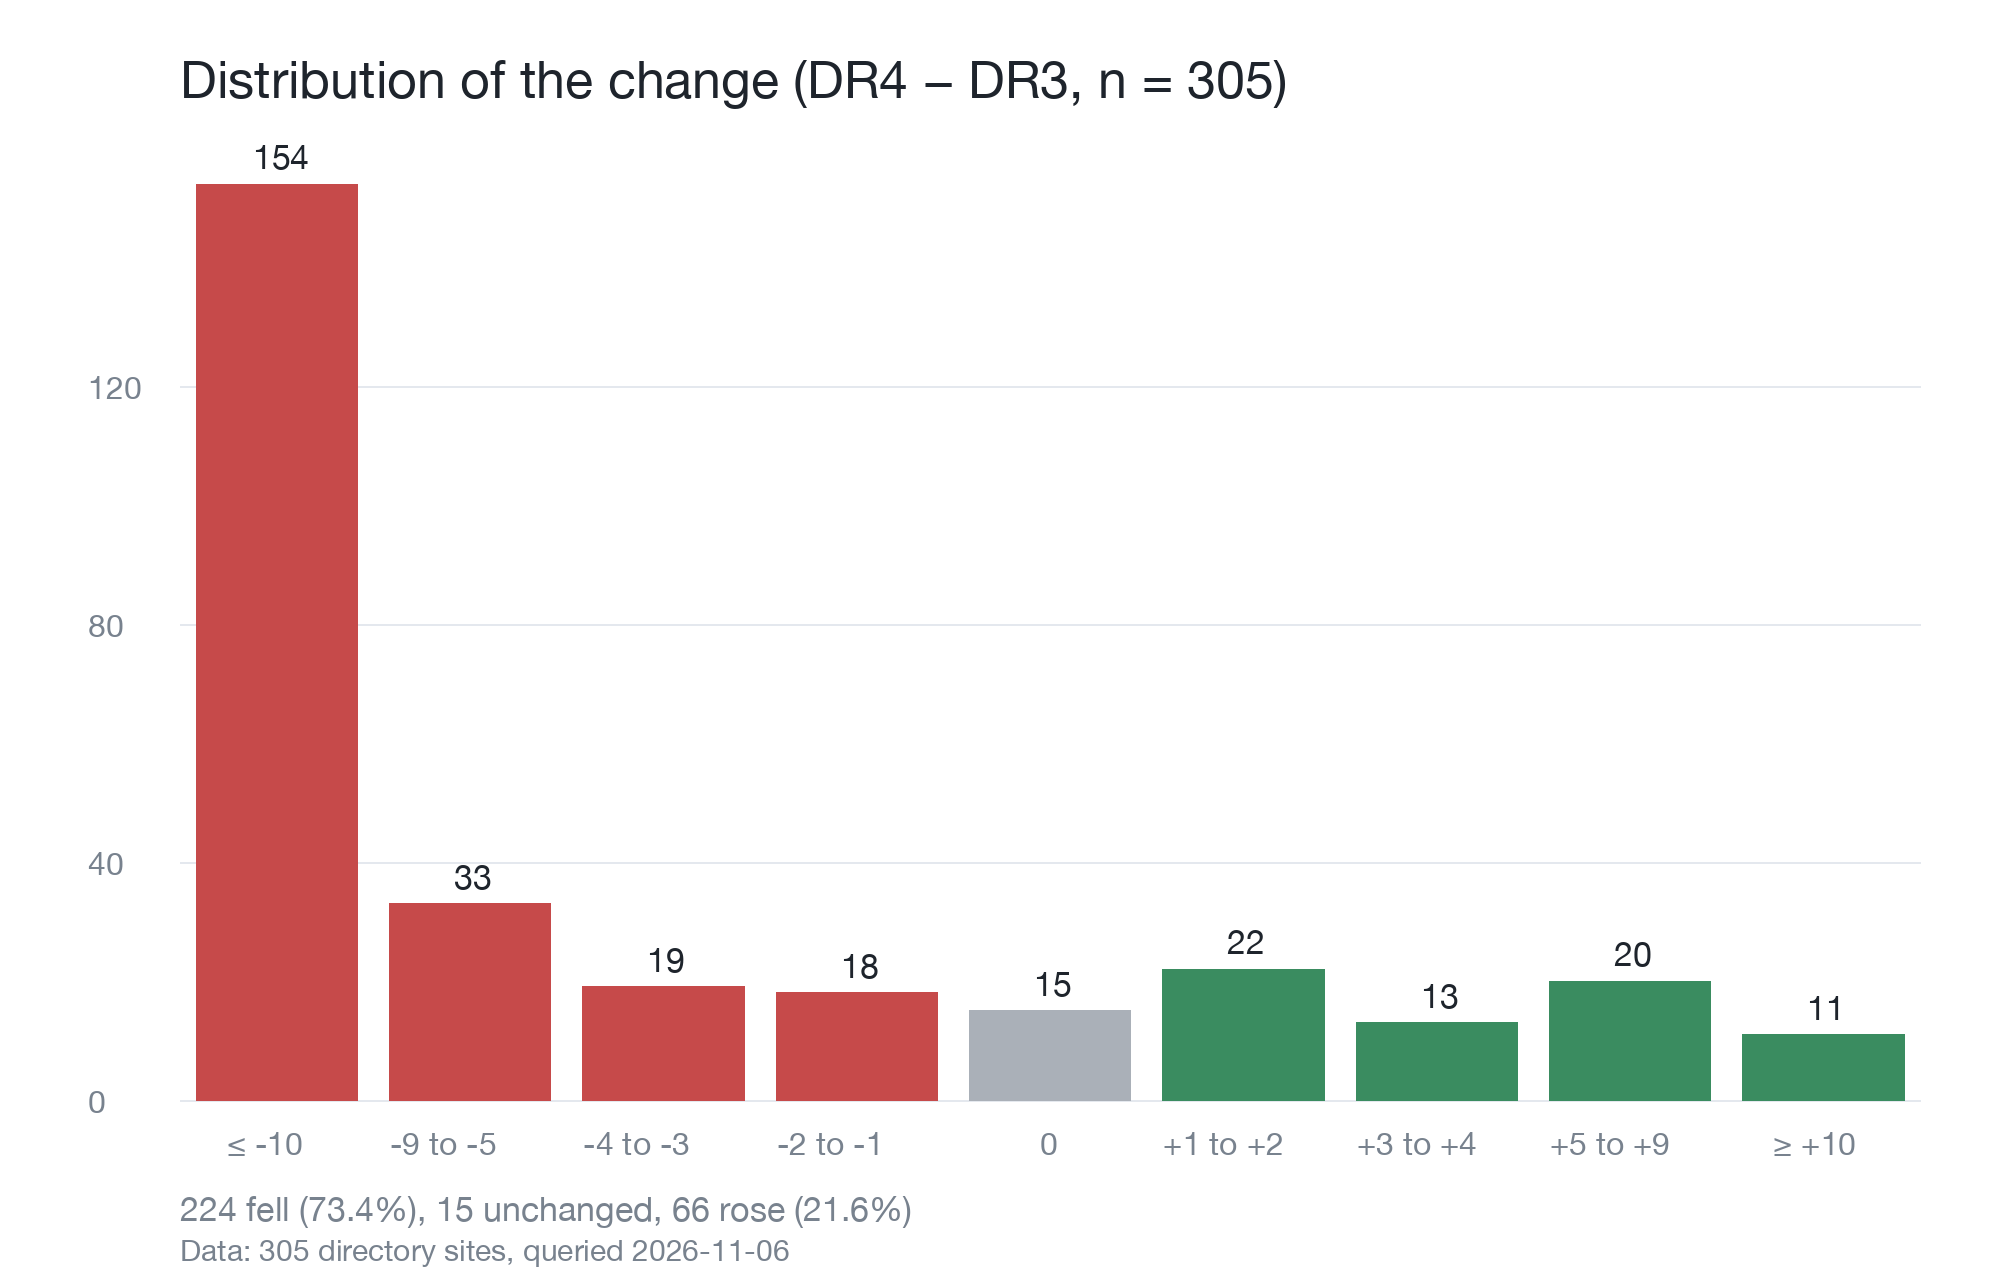
| Change | Sites |
|---|---|
| ≤ −10 | 154 |
| −9 to −5 | 33 |
| −4 to −3 | 19 |
| −2 to −1 | 18 |
| 0 | 15 |
| +1 to +2 | 22 |
| +3 to +4 | 13 |
| +5 to +9 | 20 |
| ≥ +10 | 11 |
The distribution is right-skewed, with the long tail on the losing side: 31 sites fell by more than 40 points. The median change is −10 while the mean is −14.2, and that gap comes from those extremes.
A least-squares fit over the whole sample gives DR4 ≈ −15.77 + 1.027 × DR3. The slope is close to 1, the intercept around −16, which looks like "everything moved down 16 points". How much to trust that fit is a separate question: the Pearson correlation is only 0.734 and the residual standard deviation is 17.3, the same size as the effect. Estimate any single site with "minus 16" and you may be off by more than the site actually lost.
| Domain | DR3 | DR4 | Change |
|---|---|---|---|
| aitools.neilpatel.com | 91 | 6 | −85 |
| launchpanda.dev | 62 | 0.4 | −61.6 |
| publishyoursaas.com | 58 | 1.2 | −56.8 |
| aicenter.ai | 33 | 53 | +20 |
| akonter.com | 49 | 65 | +16 |
If 73.4% of a sample falls, part of that fall is not a loss of links: other sites moved up and reallocated positions. Those two causes are not separable in DR alone. You need referring domain counts alongside it, which this dataset does not have. That is why everything here describes what happened, not why it happened to any particular site.
The damage is concentrated between 50 and 80
| Threshold | DR3 | DR4 | Fell out | Moved in |
|---|---|---|---|---|
| ≥ 90 | 9 | 8 | 1 | 0 |
| ≥ 80 | 31 | 24 | 8 | 1 |
| ≥ 70 | 104 | 67 | 46 | 9 |
| ≥ 60 | 152 | 94 | 64 | 6 |
| ≥ 50 | 203 | 127 | 85 | 9 |
| ≥ 40 | 239 | 156 | 86 | 3 |
104 sites cleared 70 before the change; 67 do now, a 35.6% reduction. Sites at 60 or above went from 152 to 94, down 38.2%. Above 90, the sample lost one site, and that one was a subdomain.
The exits and entries are not symmetrical. At every threshold, several times as many sites fell out as moved in: 85 against 9 at the 50 line, 64 against 6 at 60, 46 against 9 at 70, 8 against 1 at 80. This revision produced one-directional downward movement.
The 40 line looks similar to the 50 line (86 out, 3 in) for a different reason. 239 of the 305 sites were already above 40, so there was little room to move in, and the density just below 40 is thin. Movement near that line is squeezed from both ends.
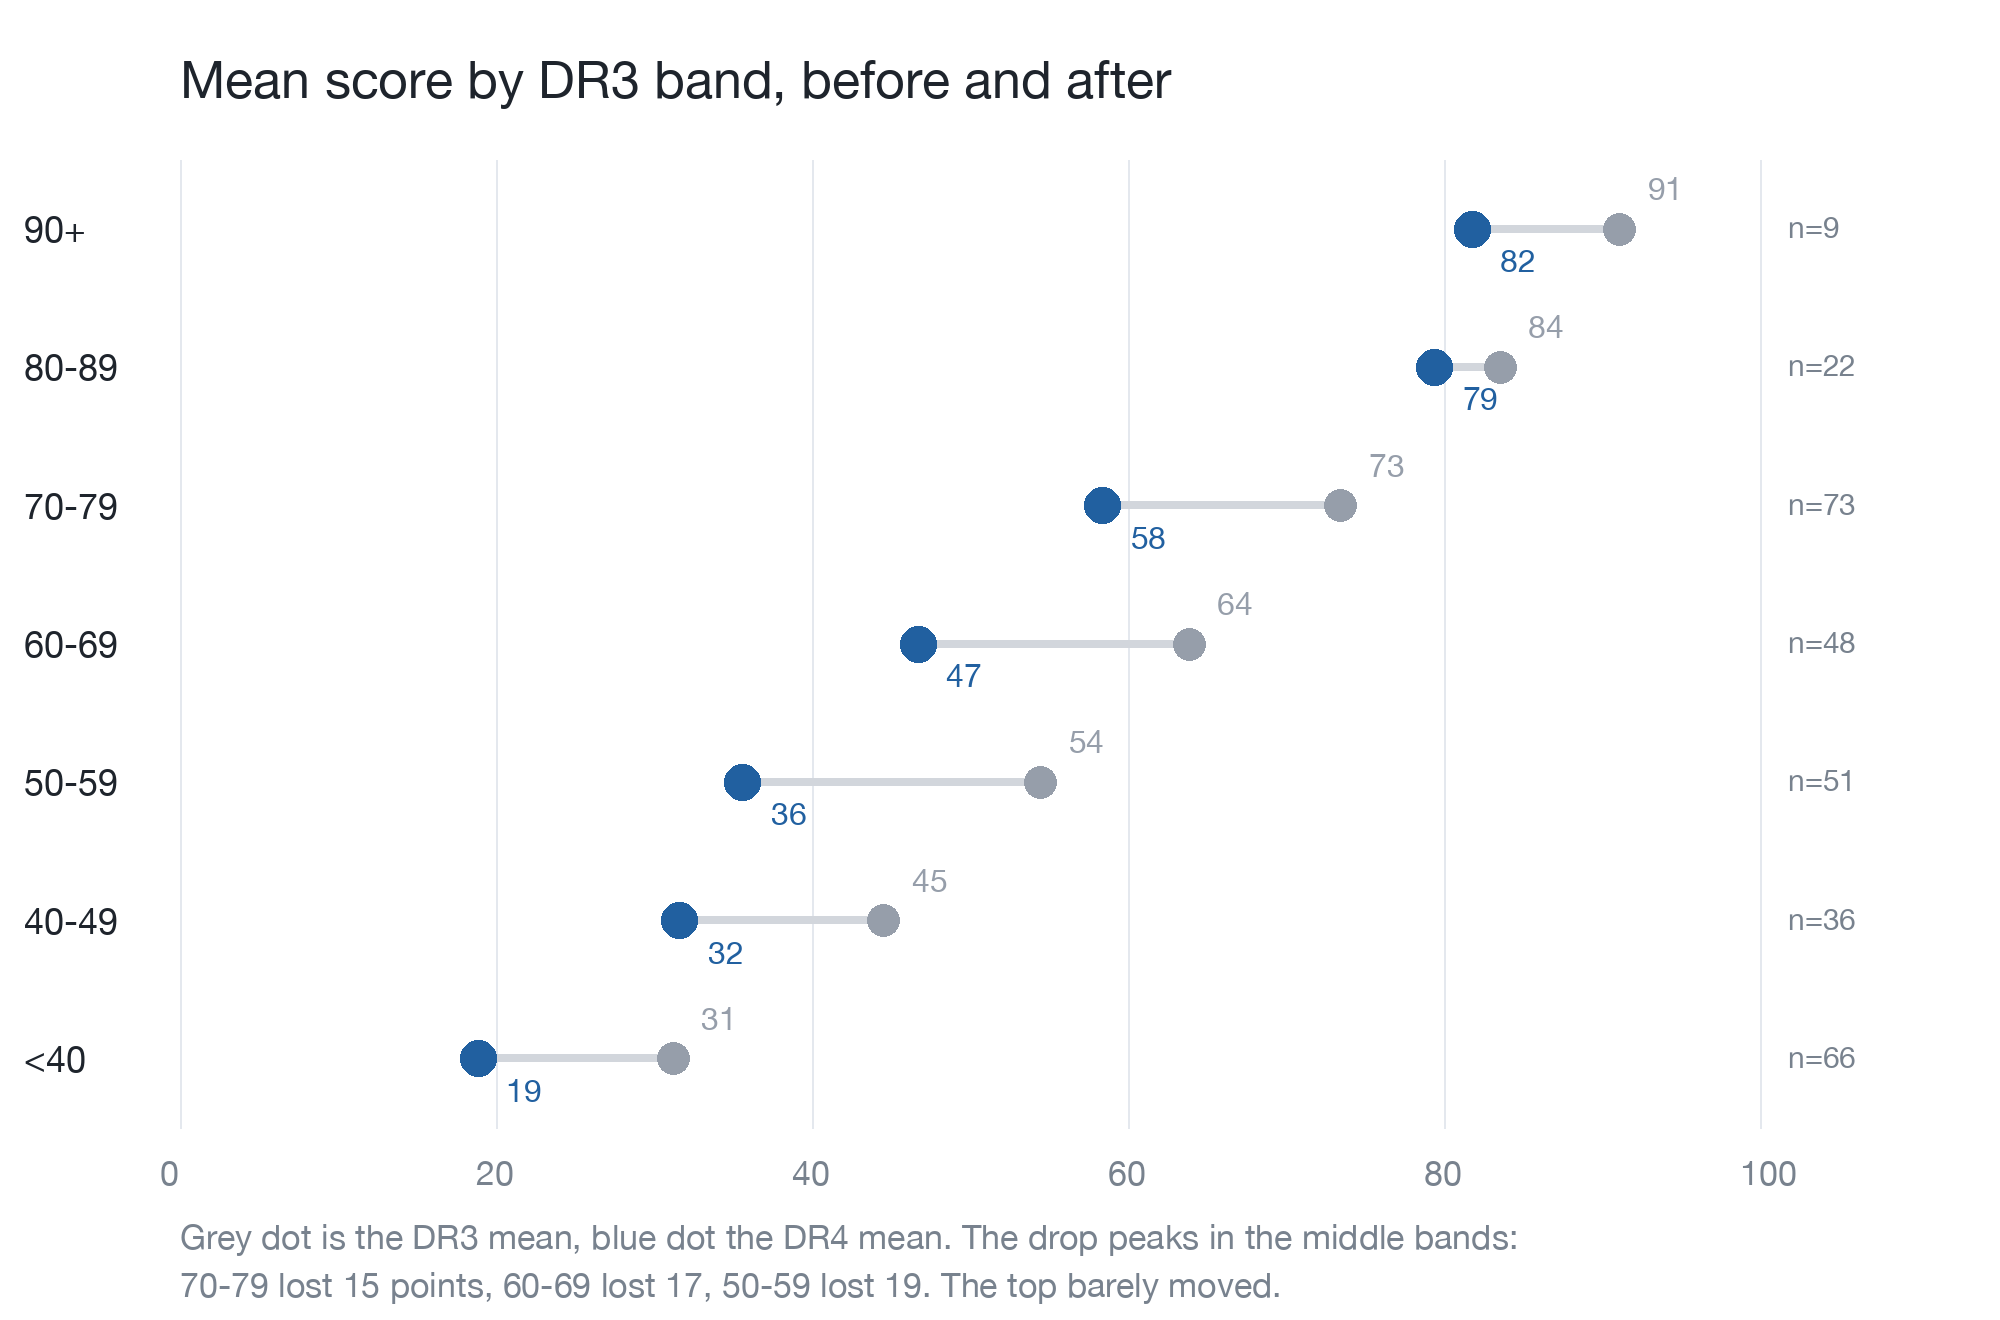
| DR3 band | Sites | DR3 mean | DR4 mean | Change |
|---|---|---|---|---|
| 90+ | 9 | 91.1 | 81.8 | −9.3 |
| 80–89 | 22 | 83.5 | 79.4 | −4.1 |
| 70–79 | 73 | 73.5 | 58.4 | −15.1 |
| 60–69 | 48 | 63.9 | 46.7 | −17.1 |
| 50–59 | 51 | 54.5 | 35.6 | −18.9 |
| 40–49 | 36 | 44.6 | 31.6 | −12.9 |
| < 40 | 66 | 31.2 | 18.9 | −12.4 |
The loss peaks in the 50–59 band at −18.9 and shrinks toward both ends. That shape fits the logarithmic rule. High scores are sparse at the top of the scale, where one point means a large change in link strength, so those sites do not slide easily. The middle is crowded, so a reallocation pushes a whole band down and the arithmetic looks dramatic.
The 90+ band's mean of 81.8 sits well below its median of 91, and one sample is responsible. Remove aitools.neilpatel.com at −85 and the band barely moves.
Subdomains and the bottom of the scale
Four entries in the sample are subdomains, and they behave nothing like the root domains.
| Domain | DR3 | DR4 | Change |
|---|---|---|---|
| aitools.neilpatel.com | 91 | 6 | −85 |
| tools.launchllama.co | 74 | 30 | −44 |
| tools.robingood.com | 31 | 13 | −18 |
| news.ycombinator.com | 91 | 91 | 0 |
The first three lost an average of 49 points. The 301 root domains lost 13.9 on average. aitools.neilpatel.com shared a score of 91 with its parent domain under DR3; scoring it on its own links under DR4 leaves it at 6. That is the same mechanism behind example*.notion.site going from 92 to 0. news.ycombinator.com did not move at all, because its link profile was already concentrated on the subdomain. It was never borrowing the parent's score.
Under the old model, a subdomain on a large platform inherited the platform's score, so a xxx.notion.site or xxx.hostingersite.com page with almost no links of its own could show 90+. Ahrefs called this out directly: subdomains of GitHub Pages, Blogspot and various site builders had been sitting at the top of DR-sorted link reports despite weak link profiles of their own. DR4 takes the borrowed score back.
The bottom of the scale behaves differently too. Every DR3 value in the sample is an integer. DR4 produces decimals: 13 sites carry one (0.1, 0.4, 1.2, 1.4, 2.6, 2.8, 3.5, 3.8, 4.3, 4.9) and six sit at exactly 0. All six of those return HTTP 200, so they are live sites, not expired domains.
Given that DR4 covers about half as many sites as DR3, a 0 or a single digit most likely means negligible weight in the new model rather than an absence of links. DR3 reported whole numbers and nothing in this sample sat below 19; DR4 reports one decimal place and reaches 0.
Across the whole sample, 38 sites (12.5%) are below 10 and 62 (20.3%) below 20. That pile-up at the floor is not the shape of a continuous distribution.
Why this sample fell further than Ahrefs' own
Ahrefs says non-spam sites are stable, with median change near zero, and the median here is −10. Organic traffic accounts for the difference.
Monthly traffic was available for 176 of the 305 domains. Split by tier, the loss shrinks as traffic rises.
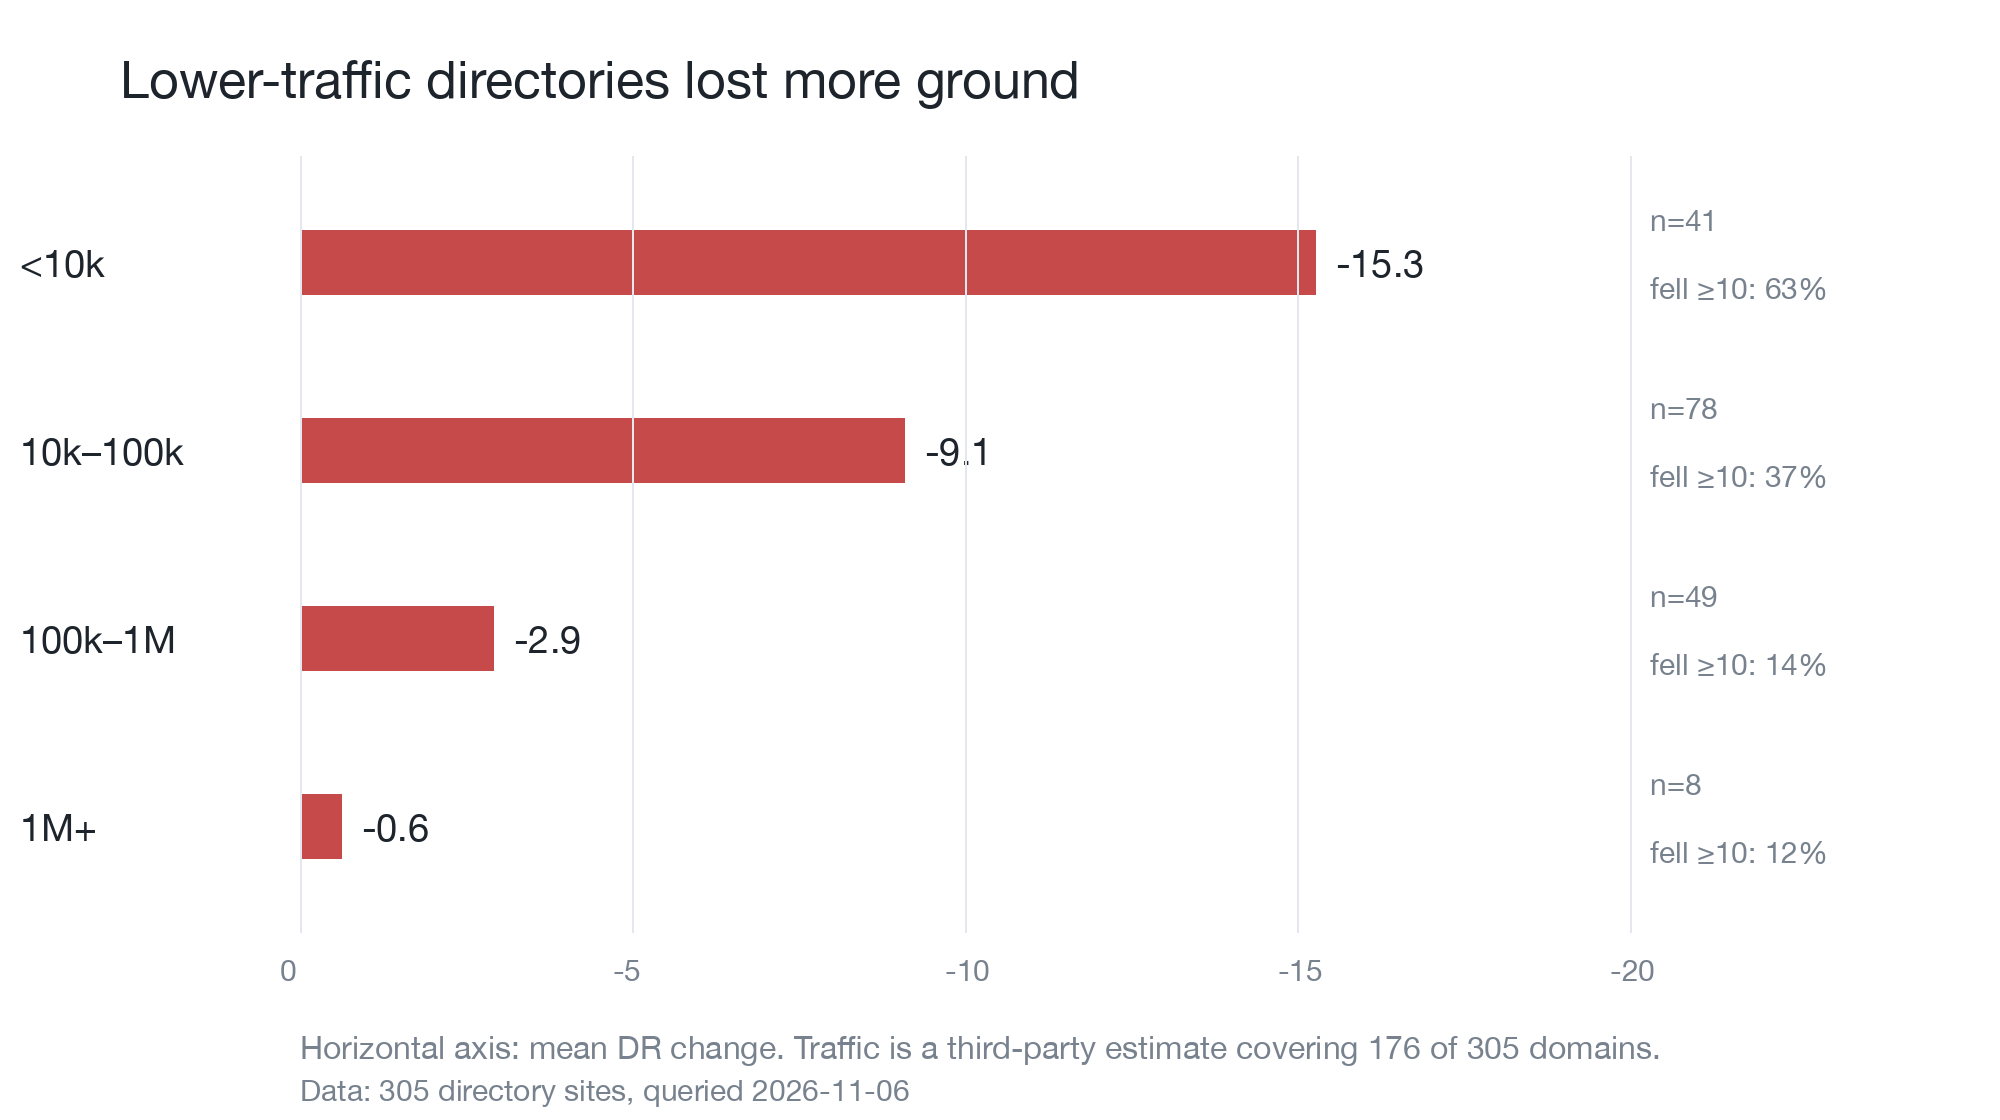
| Monthly traffic | Sites | DR3 mean | DR4 mean | Mean change | Median change | Fell ≥10 |
|---|---|---|---|---|---|---|
| < 10k | 41 | 50.8 | 35.5 | −15.3 | −14 | 63.4% |
| 10k–100k | 78 | 59.6 | 50.5 | −9.1 | −6 | 37.2% |
| 100k–1M | 49 | 66.8 | 63.9 | −2.9 | −1 | 14.3% |
| 1M+ | 8 | 84.0 | 83.4 | −0.6 | 0 | 12.5% |
Every step up in traffic order of magnitude roughly halves the loss. The correlation between log10(monthly traffic) and DR change is 0.358.
This matches how DR4 was designed. The new model prefers links from sites that are assessed as having organic search traffic, and low-traffic directories are the losers under that rule. They are also most of this sample: of 176 sites with traffic data, 119 are under 100k.
Against the groups Ahrefs published:
| Group | Profile | Median change |
|---|---|---|
| This sample | Directories, mostly under 100k monthly visits | −10 |
| Ahrefs index, non-spam | — | ≈ 0 |
| Ahrefs spam, DR3 30–70 | Flagged as spam | −15 to −20 |
| Ahrefs top 1,000 by traffic | High traffic | −4 for those that fell; 64.3% rose |
The sample sits between the non-spam and spam groups, close to the spam side. Those directories were probably never flagged as spam: they combine low traffic with high outbound link counts, and the new model penalises both.
All of this is correlation. I did not capture referring domain counts or spam flags, so for any individual site I cannot say whether it lost points because it lost links, because it was demoted, or because its relative position shifted under it.
Using the numbers
If you know a site's DR3, this table estimates where it lands.
| DR3 band | DR4 mean | DR4 median |
|---|---|---|
| 90+ | 81.8 | 91 |
| 80–89 | 79.4 | 83 |
| 70–79 | 58.4 | 67 |
| 60–69 | 46.7 | 50 |
| 50–59 | 35.6 | 37 |
| 40–49 | 31.6 | 32 |
| < 40 | 18.9 | 18.5 |
The mean and the median diverge inside bands (58.4 against 67 in the 70–79 band), so within-band spread is wide. Because the scale is logarithmic, comparing absolute differences across bands is not meaningful.
The table also shows how much of an existing shortlist survives. Ranking the sample by each score, the tops of the two lists overlap:
| List | Overlap |
|---|---|
| Top 20 | 80% |
| Top 50 | 72% |
| Top 100 | 70% |
The mean rank change is 49.4 places, and 250 sites (82.0%) moved more than 10 places. The top 20 is close enough to keep. Past 50, a list needs re-checking before you use it.
In practice, thresholds need converting. A DR3 ≥ 60 cut kept 152 of these sites; a DR4 ≥ 60 cut keeps 94. If you want a candidate pool the same size as the old one, the DR4 threshold is somewhere around 40 to 45. Makers building a submission list from directories in Explore will feel this most at the volume end: the long tail of small directories moved the furthest.
Treat subdomains as suspect until checked. A directory living at tools.something.com earned its old score largely from the parent domain, and needs a fresh lookup under the new model.
Do not use a constant offset. −16 is a population mean, and with a residual standard deviation of 17.3 the error for a single site can be as large as the effect you are trying to correct. For an exact number, query the DR API with version=dr4.
For choosing directories for a launch, the ranking matters more than the cause. The SEO Playbook for Launch Sites and Tool Directories covers what to do with the list once you have one.
Limits
- The sample is directories, which skew toward low traffic and high outbound link counts. Nothing here should be extrapolated to sites in general.
- DR4 is still a preview. The full release is 2026-12-01 and the figures here are a 2026-11-06 snapshot.
- Only DR was captured. Without referring domains, spam flags or outbound link counts, single-site attribution is not possible.
- Monthly traffic is a third-party estimate, covers 176 of 305 domains, and different sources may measure it differently.
- DR values came from Detailed.com's DR3/DR4 comparison page rather than Ahrefs' API. Nine domains were spot-checked and matched the page. Ahrefs also publishes a DR API with a
version=dr4parameter for independent verification. The comparison page was built by an Ahrefs employee (Glen Allsopp, Head of Marketing Strategy & Research) and is an authorised preview channel.
References
- Introducing a Preview of DR4, Ahrefs announcement, 5 November 2026
- What is Domain Rating (DR)?, Ahrefs help centre
- detailed.com/dr-v4, DR3/DR4 lookup page
If this article helped, leave a clap or join the discussion below.
Keep Reading
View all articlesRelated on Shipstry
Live catalog pages that match this article.
Launch Your Product This Week
View all launchesProducts shipping this week on Shipstry. Vote for your favorites and help makers get discovered.



Comments
Questions, pushback, and additions are welcome.